Digital transformation of survey system

Responsive web surveys designed for workers in SG + CRM for saving and handling the survey responses (real-client project)
UX techniques used in this project:
Mid-Fidelity Prototyping
Customer Journey Mapping
Usability Testing
Persona Crafting
UX Research
Project Brief
The project client was looking for a digital solution to help their team to improve their work processes. Manual workloads should be reduced resulting in increased work efficiency while reducing project costs.
The project client is working with a Singapore government agency, Workplace Safety and Health Council (WSHC) to help promote safety and health at work and recognise companies with good WSH records. At the project client’s customer location, a session to promote workplace safety and health to the customer’s staff will be conducted and the session participants will have to fill up a survey form created by WSHC (as seen in the image below), that enquiries on the safety and health conditions facilitated in the company. The survey responses will be analysed by the project client and the results will be submitted to WSHC and the project client customers.

UX research - understanding the needs of my client
Before starting the project, it is important to understand the needs of the project client. Hence, the customer journey map (as seen in the image below) was done to understand the initial work process and to find opportunities to improve on the situation.

From the customer journey, we understand that the system is divided into 2 different parts. One being the digital survey forms that are to be responded by the session participants. While the other is a backend system, a CRM that stores the survey responses and allow the project client to export the responses out into an excel sheet for further data analysis. Hence, a simple persona crafting (as seen in the image below) was done to help understand the CRM users to better design the CRM to suit their work needs.

Functionalities of the CRM designed
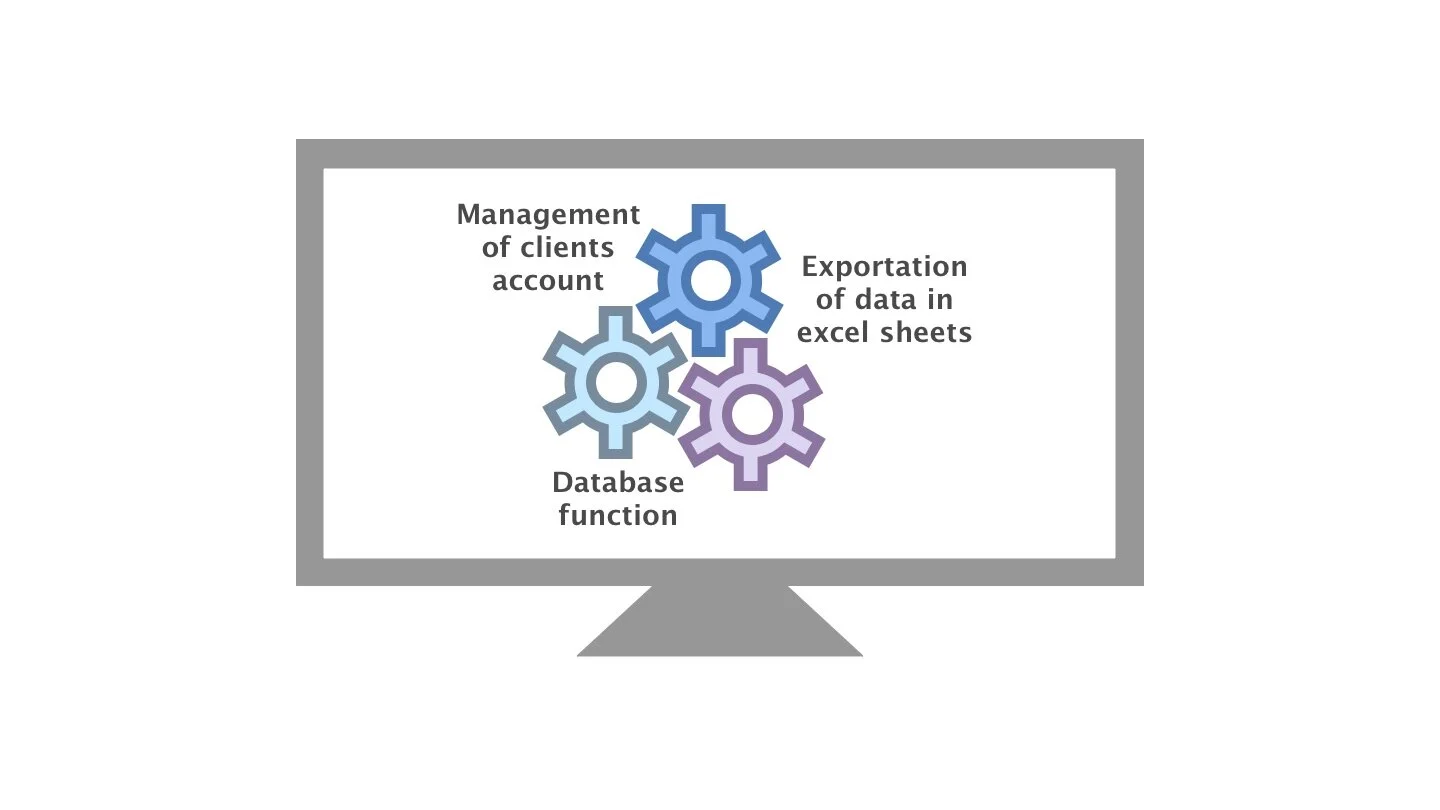
1) Management of clients account
A management function that allows the project client manage their clients account which entitles the responses of the subjected client company to be saved properly.
2) Database function
All responses are saved and displayed when filtered.
3) Exportation of data in excel sheet
Allows the exportation of survey responses into an excel sheet for further data analysis.
Benefits of the digital survey system
From project client’s point of view
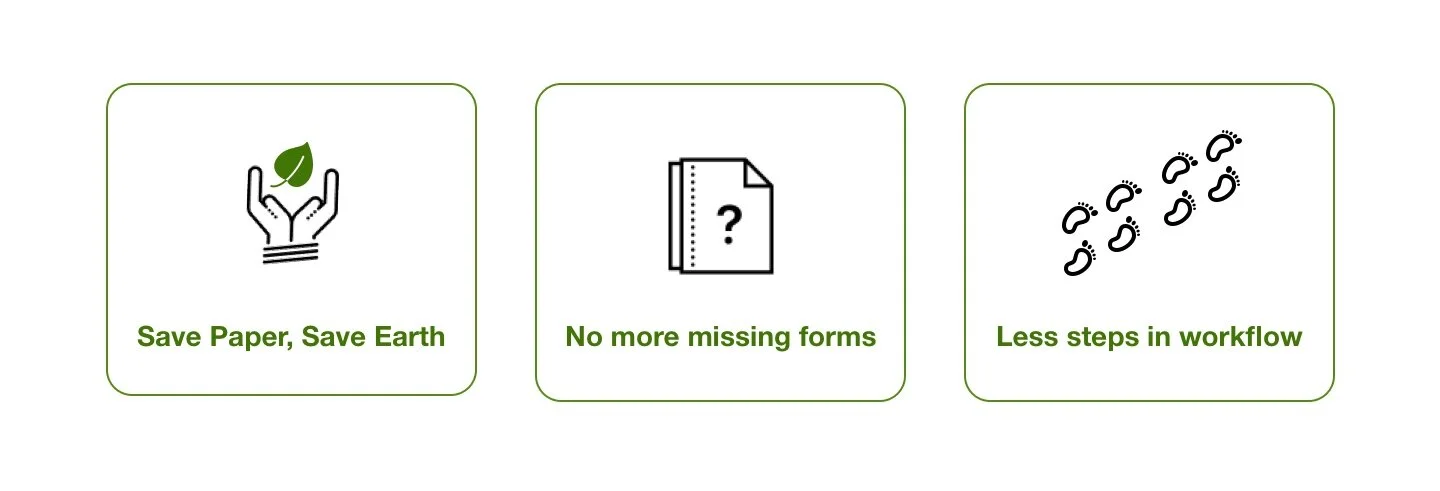
1) Save paper, Save Earth
As each survey forms is at least 8-pages long, number of papers needed for the printing of these survey forms are massive. As the society is becoming much more environment-conscious, moving to digital survey forms allows the project client to be much more environmentally-friendly.
2) No more missing survey forms
With the survey responses getting saved in the CRM automatically when survey respondents submitted their responses, the need to collect the completed survey forms and the possibility of missing any survey forms can be greatly reduced.
3) Step to transfer survey responses from paper to excel sheet can be eliminated and the responses can now be exported to an excel sheet with just a click
Since responses are saved in the CRM and can be exported to an excel sheet that can be downloaded, time and effort needed to key in the survey responses can be reduced significantly. And this includes the probability of human errors that is prone to happen in such information transfer situations
From survey participants’ point of view
1) Responses can be edited efficiently and edits can be shown clearly
Editing responses on paper can be very messy and sometimes can be unclear due to various reasons e.g. limited paper space. When responses are given in digital forms, edits made to the input can be done efficiently and shown clearly.
2) Responses would be submitted successfully
As input responses will be captured automatically when users submitted their responses, the time and effort survey participants had put into completing the survey will not be wasted.
UX research - Understanding potential survey respondents

Since the session will be conducted during working hours, many session attendees might not have the patience and time to complete the survey. And the survey content cannot be changed as they are determined by the WSHC. Hence, the visual of the survey form have to aid respondents in completing the survey fast while accommodating to those who may have trouble reading and grasping the meanings.
In addition, the devices used by the session participants may vary, which is why the digital survey has to be responsive to the devices’ screen sizes.
Challenge in designing the digital survey forms
Based on understanding the different pain points from possible survey respondents, the main challenge in designing the digital survey forms are as the following:

1) Users do not want to spend much time on doing surveys
However, as the survey contents are pre-determined by the government agency, the content cannot be changed. Hence, the digital survey forms have to visually mask its long content so that survey respondents will not feel like giving up on completing the survey forms.
2) Users have to answer at least 50 questions in one seating
Effort needed to complete the survey forms is quite massive hence the digital survey forms have to be designed such that eye strains induced during digital reads can be reduced. This is especially important to users with reading difficulty, that could be due to bad eyesight or language unfamiliarity.
Designed User Flow

Design details according to Usability test and After-Sales feedbacks
1) Saving every page responses when the users proceed to the next page of the survey
As the survey has more than 50 questions, there is a possibility that
Users might give up halfway before completing the survey forms, which more than half of the usability testing participants did mentioned of that thought during the test
Users might want to change their response to a previous question whereby about 3 out of 7 of the participants encountered somewhere during the middle of the usability testing
Hence, the responses of each survey page will be saved when users proceed to the next survey page, as seen in the image below. Furthermore, such data can be sent to WSHC to improve on the survey content for the next iteration of the survey.

2) A new radio button design is in use rather than the usual radio button
Since the survey has more than 50 questions in total, the usual radio button design would require a huge real estate for every question that requires one answer in a range of options given.
Hence, a new design for the radio button was used and made possible by the usage of a combination of programming languages namely HTML, CSS and Javascript. And with that new design, the real estate needed would be significantly reduced (as seen in the image below) which leads to
the illusion of not many questions to be answered in a page as agreed by 5 out of 7 usability test participants
answer options can be seen in a glance together with the question to be answered which reduce user’s time and effort in answering the question which was preferred by all 7 usability test participants

3) Increase session key timing (duration that a user can be inactive while answering the survey) from the usual 30 mins to 60 mins
Out of 7 usability testing participants, there were 4 participants who were above 40 years old whereby 2 of them only have a basic understanding and command of the English language. And all 4 of them took more than 20 mins for a survey page that had the most number of survey questions. Hence, the usual 30 mins session key timing would not be enough for the survey participants of an older age group and those with only basic command of the English language.
To accommodate most survey participants, the session key timing of the usual 30 mins is doubled to 60 mins.
4) Allow the entering of input in either order for height and weight to calculate the BMI values
As what most people would do, we would usually answer the question that comes first which in this case as seen in the image below, the survey asked for the survey respondents’ height before asking for their weight. Hence, the initial programming method was for the system to get the height input and the weight input to auto-calculate the BMI value to be displayed.

However, during the usability test, an impromptu question on asking if the test participant would input which detail (Height/Weight) first. It came to a surprise that 2 out of 7 of the usability test participants will “input” their weight details first.
When prompted on why they would answer their weight details before their height, the 2 participants answered that as they were certain of their weight details while they were uncertain of their height details. Hence, they would prefer to input the information they were certain of first before giving some thoughts to recall of their height information.
Thus, with that finding, the programming method was changed to accommodate the calculation of BMI values from both height and weight inputs regardless of the input order.
5) Error message to be shown to notify users on invalid input or incompletion of questions before submission
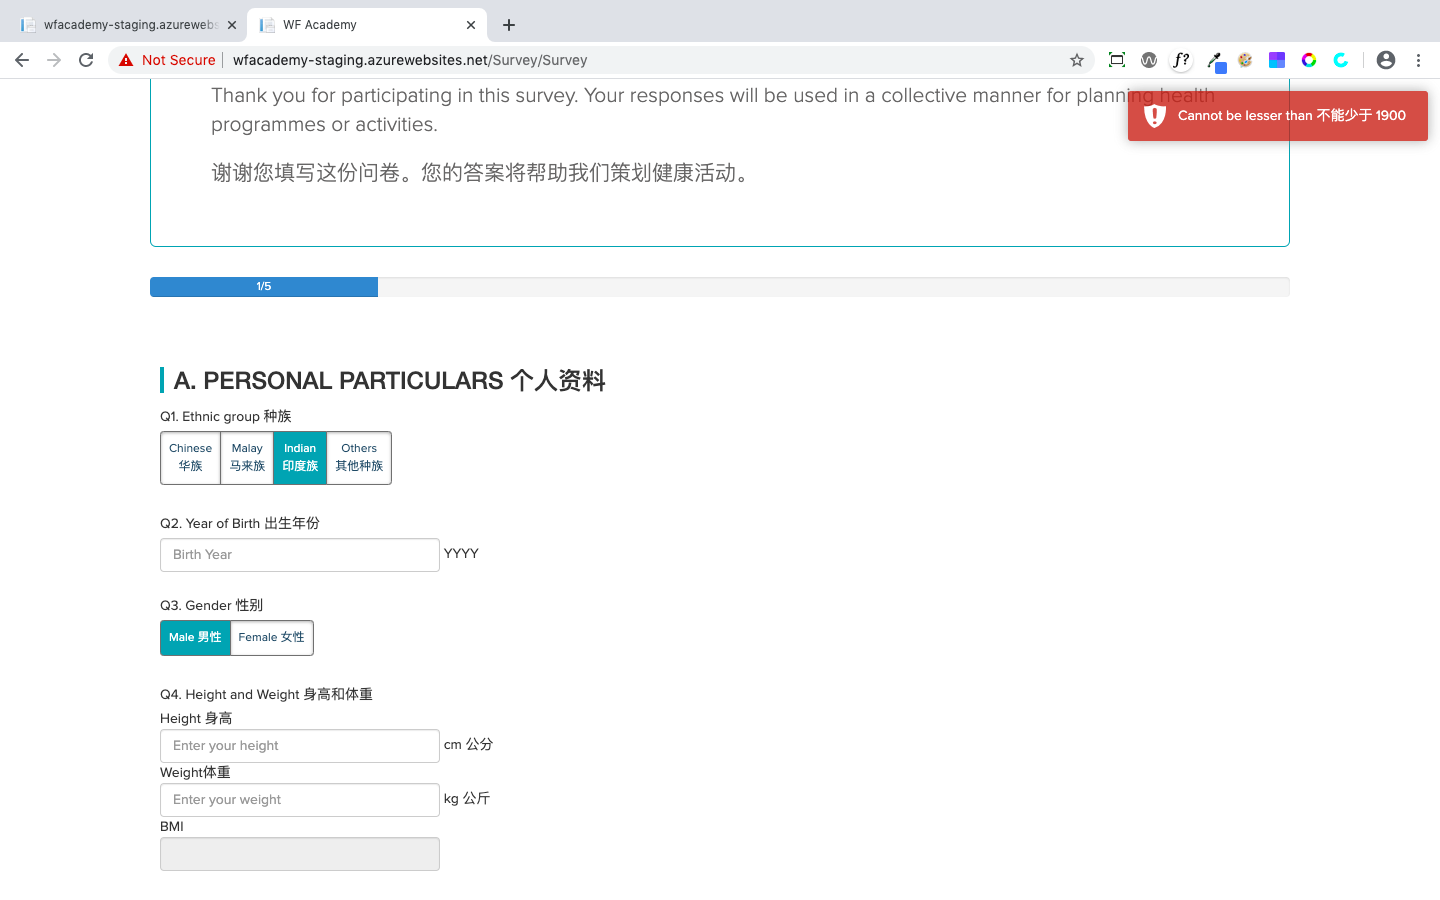

Real-time indication of error message will be shown to notify the users of their interaction with the system to avoid any confusion. And thereby able to ensure that all inputs are valid and every survey submission is completed.
6) System to accept possible inputs with up to 3 decimal places
After the system had gone live for a few months, the client had feedback-ed that everything was working as per what they expected, except for the following:

- What went wrong? -
When checked against the database, we realised that the blanks were due to inputs not being saved in the database. Which was why nothing were captured, saved, displayed in the CRM and hence nothing was exported to the excel sheet as well.
When investigated by calling and asking some of the survey respondents whose responses had such abnormality, we understood that we had missed out the fact that certain inputs could be numbers with decimals apart from height and weight inputs. This was the problem as the database was not programmed to accept inputs with decimal places apart from height and weight details.
- Solution to fix the problem feedback-ed -
The database was programmed to accept possible number inputs with up to 3 decimal places.
- Why was this problem not identified during usability testing with the prototype? -
The focus of the usability test was more on the digital survey form’s readability and getting the survey respondents to not give up before completing the survey.
In order to speed up the usability test, the participants were not asked to answer all the questions in the survey. Instead, only 2 out of 5 of the digital survey pages were selected for the usability test. As with a prototype, the usability test participants were not able to really input their answers. So, for questions that requires answers to be typed, the usability test participants were only asked to read and explain what they understood the questions were asking in their own words.
Hence, the problem of responses with decimal numbers were not identified.
- What could be done to avoid such situations in the future? -
Instead of just asking usability test participants to explain what they understood the questions were asking in their own words, directly ask the participants what their answers will be. Not only could the above situation mentioned be avoided, the answers by the participants would also shine some light on their understanding on the survey questions asked.
